
- Manufacturers in Asia raise purchasing volumes in response to order book pick up – factories in China, Japan, Korea and India bought materials more aggressively in January
- North America’s supply chains at their busiest since May 2024 as US industrial economy shows resilience
- Europe remains the laggard, with firms reluctant to restock, although there are tentative signs of recovering demand
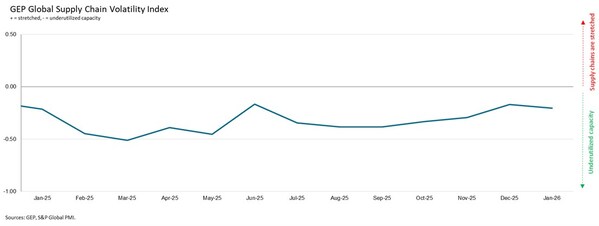
CLARK, N.J., Feb. 11, 2026 /PRNewswire/ — GEP Global Supply Chain Volatility Index — a leading indicator tracking demand conditions, shortages, transportation costs, inventories and backlogs, based on a monthly survey of 27,000 businesses — showed a marked bounce back in procurement activity in January.

Interpreting the data:Index > 0, supply chain capacity is being stretched. The further above 0, the more stretched supply chains are. Index < 0, supply chain capacity is being underutilized. The further below 0, the more underutilized supply chains are.
Procurement activity in many of the globe’s major economies expanded, driving the strongest rise in worldwide demand for commodities, raw materials and components in almost four years.
Industrial firms in major economies such as China, Japan, Korea, India, as well as across ASEAN markets underpinned the expansion, highlighting broad-based strength across the region.
North America, which saw a slowdown through the final quarter of 2025, regained momentum as 2026 kicked off, driven by a pick-up in the US’ manufacturing economy. Factory leaders across the continent also showed a greater appetite for inventory building, suggesting a certain degree of confidence in order pipelines.
Europe’s manufacturing sector was the laggard in January, with firms here still showing nervousness to overstock warehouses. A cooling of the downturn in purchasing activity, however, tentatively points to an improving outlook.
After several months of treading water, January’s data points to a broad-based recovery across U.S. manufacturing, spanning all sectors,” said John Piatek, Vice President, Consulting, GEP. “Despite tariffs and trade uncertainty, manufacturers are showing real resilience, supported by a declining cost of capital that’s giving procurement teams greater flexibility to adjust sourcing and inventories.”
JANUARY 2026 REGIONAL KEY FINDINGS
- ASIA: Index rises to 0.12, from -0.20, signalling that the supply chains of Asia’s manufacturers were their busiest since November 2024 in January.
- NORTH AMERICA: Index rises to 0.06, from -0.37, indicating capacity at North America’s suppliers was the most stretched in just over a year-and-a-half.
- EUROPE: Index dropped to -0.27, from -0.17, signaling greater spare capacity at Europe’s suppliers than at the end of 2025.
- U.K.: Index fell to -0.17, from 0.12, pointing to a weakening of the U.K.’s manufacturing sector as its supply chains were underutilized at the start of 2026.
JANUARY 2026 KEY FINDINGS
- DEMAND: Global demand for commodities, raw materials and intermediate goods rose by its strongest margin in almost four years during January, as manufacturers in major economies stepped up their purchasing activity at the start of 2026. Asia was a key component of this upturn, with buying growth seen in China, Japan, Korea, India, and across ASEAN, although US manufacturers also expanded procurement.
- INVENTORIES: Globally, reports of manufacturers intentionally stockpiling due to price or supply worries were muted. This suggests that procurement leaders are not overly concerned about product price inflation or supply. Regional differences emerged, however, with inventory building rising in North America, whereas destocking continued in Europe.
- MATERIAL SHORTAGES: The global items in short supply indicator stayed below its long-run average, as has been the case for nearly two-and-a-half years. This means that global businesses are experiencing shortages less frequently than normal.
- LABOR SHORTAGES: Labor is not a limiting factor for global production, as global manufacturers’ reports of backlogs increasing due to a lack of staff were below historically typical levels during January.
- TRANSPORTATION: With global oil prices rising in January, the latest data pointed to an increase in transportation costs at the start of the year.
For more information, visit www.gep.com/volatility.
Note: Full historical data dating back to January 2005 is available for subscription. Please contact economics@spglobal.com.
The next release of the GEP Global Supply Chain Volatility Index will be 8 a.m. ET, Mar. 11, 2026.
About the GEP Global Supply Chain Volatility Index
The GEP Global Supply Chain Volatility Index is produced by S&P Global and GEP. It is derived from S&P Global’s PMI® surveys, sent to companies in over 40 countries, totaling around 27,000 companies. The headline figure is a weighted sum of six sub-indices derived from PMI data, PMI Comments Trackers and PMI Commodity Price & Supply Indicators compiled by S&P Global.
- A value above 0 indicates that supply chain capacity is being stretched and supply chain volatility is increasing. The further above 0, the greater the extent to which capacity is being stretched.
- A value below 0 indicates that supply chain capacity is being underutilized, reducing supply chain volatility. The further below 0, the greater the extent to which capacity is being underutilized.
A Supply Chain Volatility Index is also published at a regional level for Europe, Asia, North America and the U.K. For more information about the methodology, click here.
About GEP
GEP® delivers AI-powered procurement and supply chain solutions that help global enterprises become more agile and resilient, operate more efficiently and effectively, gain competitive advantage, boost profitability and increase shareholder value. Fresh thinking, innovative products, unrivaled domain expertise, smart, passionate people — this is how GEP SOFTWARE™, GEP STRATEGY™ and GEP MANAGED SERVICES™ together deliver procurement and supply chain solutions of unprecedented scale, power and effectiveness. Our customers are the world’s best companies, including more than 1,000 Fortune 500 and Global 2000 industry leaders who rely on GEP to meet ambitious strategic, financial and operational goals. A leader in multiple Gartner Magic Quadrants, GEP’s cloud-native software and digital business platforms consistently win awards and recognition from industry analysts, research firms and media outlets, including Gartner, Forrester, IDC, ISG, and Spend Matters. GEP is also regularly ranked a top procurement and supply chain consulting and strategy firm, and a leading managed services provider by ALM, Everest Group, NelsonHall, IDC, ISG and HFS, among others. Headquartered in Clark, New Jersey, GEP has offices and operations centers across Europe, Asia, Africa and the Americas. To learn more, visit www.gep.com.
Media Contacts
Derek Creevey
Director, Public Relations
GEP
Phone: +1 646-276-4579
Email: derek.creevey@gep.com

Interpreting the data: Index > 0, supply chain capacity is being stretched. The further above 0, the more stretched supply chains are. Index < 0, supply chain capacity is being underutilized. The further below 0, the more underutilized supply chains are.

GEP Global Supply Chain Volatility Index Jan 2026